The data folks at U.S. Energy Information Administration have just created some really nice visuals showing where states in the Interior West are today on energy sources for electricity. At Resource Media we work a lot on energy in the West, and we love a good visual that tells a story or relays information without need for wading through a lot of numbers or text – so we took notice.
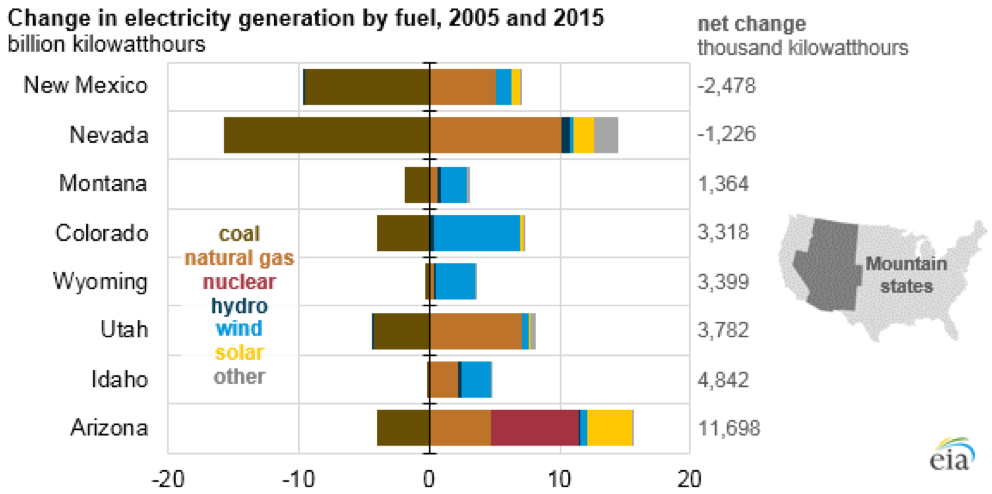
This visual below shows how much states are moving off coal and what they’re replacing it with – in some cases a lot of gas and in others a good chunk of wind power or solar.
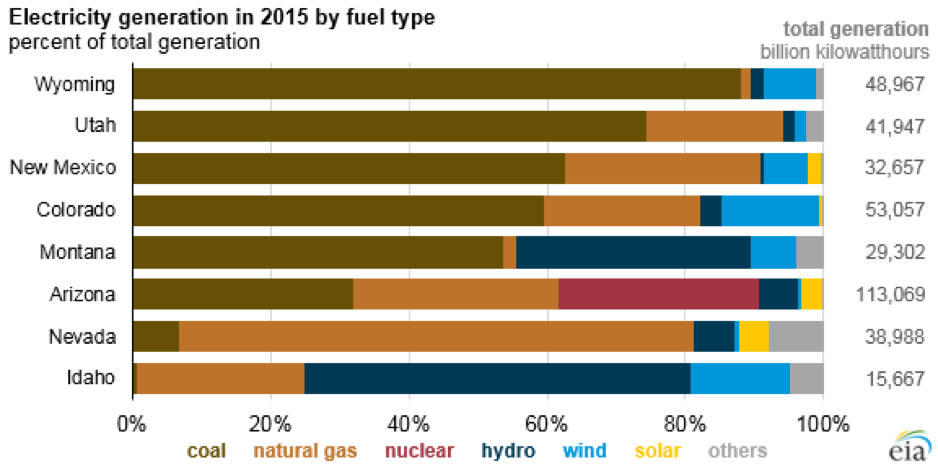
And this next one below shows all the current energy mixes for each Mountain West state as of 2015 – in most cases still a lot of brown and orange (coal and gas) compared to blue and yellow (wind and solar). There’s also a third image on the EIA page showing that this year far more solar will be added in these western states than in any year since 2005.
We’ve also tried to help bring good visuals to the world energy data, and to reach energy consumers with it directly — through a web app called PicMyEnergyMix that we developed and have worked with groups in seven states so far to promote. The tool lets you see a picture of the current mix of energy sources your utility is using, use sliders to re-make the picture to match your preferences for energy and share your views.
So with the current energy mix picture in western states out this week from EIA, we thought we’d take a check on a couple of these states where groups have been running PicMyEnergyMix to see how EIA’s current mix picture compares to the preferred energy mix pictures users of the web app have been creating.
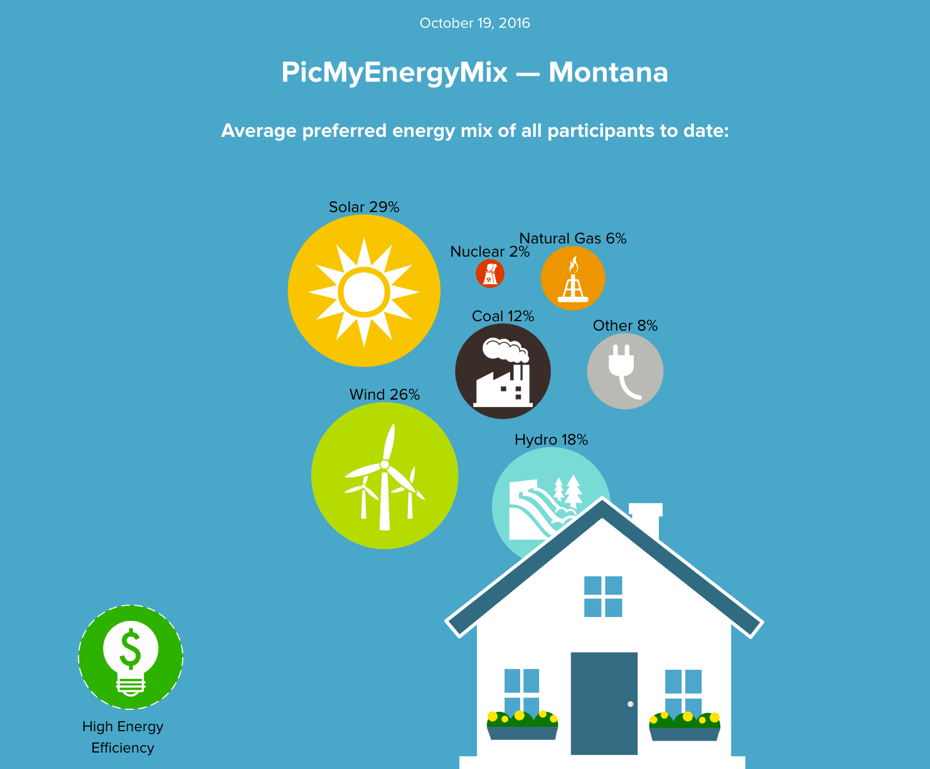
Let’s take a peek at Montana first. The picture shown below is the real-time average of all of the energy mix preferences of the more than 700 Montanans who have used the site to date. It’s quite an expression of demand for more solar and wind than we see in the current bar for Montana above.
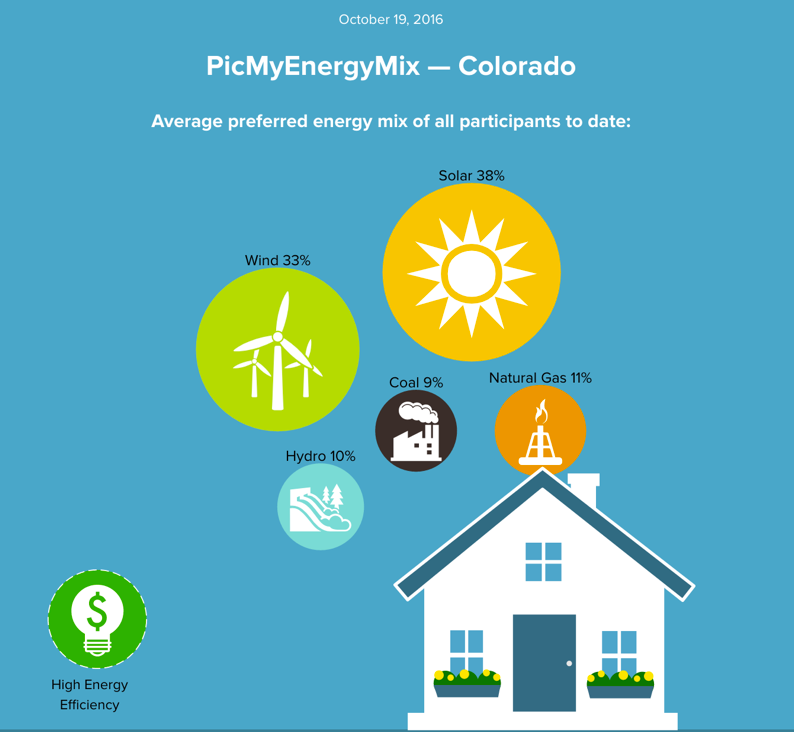
And It’s a similar story in the average preferred energy mix picture for Colorado shown below, created by more than 1,100 people have used PicMyEnergyMix.org/Colorado.
So how do these PicMyEnergyMix visuals showing where Coloradans or Montanans want to go on energy correlate with measures of public attitudes we see in professional opinion polls? Quite closely. In the latest “Conservation in the West” poll conducted this year by Colorado College’s State of the Rockies Project in seven Interior West states, most voters (63%) pick solar or wind as the energy sources they’d most like to encourage use of in their state – compared to only 9% who say natural gas and just 3% who say coal.