We often advise our partners to track their digital media results to measure the impact of their efforts. Examining communications impact is an important part of most any communications strategy, and when it comes to digital strategy, tools like Google Analytics and Facebook Insights can be extremely helpful. While Twitter continues to grow as a communications and advocacy tool, learning how many people see your tweets has been notoriously difficult.
Twitter has taken a helpful step in the right direction, by releasing its own Twitter Analytics platform (historically, only users that were advertising on Twitter had access to analytics on the site). And though it comes with a few caveats, the early returns are promising.
First, the caveats: You have to be a content publisher (or Twitter advertiser) to turn on Twitter Analytics. For most organizations with a website and a blog, this won’t be a problem. You just need to install Twitter Cards on your website or blog to access Analytics. Update: Twitter has released its Analytics platform to everyone who has an account — no need to install Cards anymore! Just go to analytics.twitter.com to get started.
The data provided by Twitter Analytics are only for the views and interactions your tweets get via Twitter.com. Left out are any views and engagement via a third-party app like Hootsuite. So the data you’ll get from Twitter can be considered a good proxy for your activity, but will likely not tell the full story.

With these caveats in mind, there is some very useful information you can glean from Twitter Analytics. Your tweets’ impressions are tracked both by day (pictured above) and individual tweet, so you can see which day or days of the week work best, and which tweet or tweets are making the difference. The current 28-day period is compared to the previous one, so you can benchmark and see how you’re doing month-over-month. And while you can’t customize date ranges like with Google Analytics or Facebook Insights, you can export the data regularly (we recommend monthly or quarterly via the “Export data” button in the upper right corner) to keep track of your progress over time.
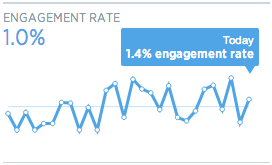
 Twitter also shows you the Engagement Rate for your handle, which includes clicks on the tweet (including links, hashtags, username, avatar, and tweet expansion), retweets, replies, favorites, or follows. The handy graph (example at right) tracks your progress over the previous 28 days.
You also get link clicks, retweets, favorites, and replies broken out in their own graphs, to help you further understand how your followers are engaging with your content. And, as with much of the data you’ll find here, each can be instructive in informing your ongoing strategy on the platform. Did you get twice as many retweets today as you did yesterday? Look at your day’s work to try to spot the pattern that encouraged your followers to share your work. Try new things, measure, report, and repeat.
Twitter Analytics also gives you some good insight into your followers: how many you have; how that’s changed over time; where they live; what they’re interested in, and more. By targeted your content to fit your followers’ interests and locations, you’ll likely earn better engagement (and more followers) over time.
With all of this new data at your fingertips, it’s important not to get lost in the metrics or bogged down in the numbers. Follow these tips to get the most out of Twitter Analytics:
- Look for larger trends, rather than getting stuck obsessing over tiny spikes or troughs. Identifying trends that you see week over week, rather than just looking at one day in a vacuum, will help inform and improve your strategy over time.
- Avoid getting fooled by vanity metrics. Your number of followers, for example, is an important metric, but isn’t always a good measure of how successfully you’re communicating. What you really want is engagement on the platform.
- Don’t try to assign meaning to everything and confuse correlation with causation. Just because that last tweet about water earned great numbers doesn’t mean you should only tweet about water from now on.
- Use the data to inform your realtime engagement. Don’t lose your voice or message in deference to the numbers you’re seeing. Remember, Twitter is best when it’s a two-way communications tool.
What do you think of Twitter Analytics? Have they changed the way you use the platform? We’d love to hear what you think.
More Twitter resources:
Resource Media’s Twitter advocacy tool
5 keys to hosting a successful Twitter party
Tipsheet: 5 steps to build your Twitter presence [pdf]
