DOWNLOAD the full report here.
Today’s urban residents are bombarded with imagery every day—from billboards, advertisements and store windows, to Facebook feeds and YouTube videos. In such an information-rich environment, it’d be easy for environmental organizations to get swept up in it all and think, “I’ve got to be out there, too! Clicks and eyeballs!”
The purpose of our Visualizing Sustainable Cities project was to explore how sustainability projects and behaviors are being visually communicated in our region, and how we can be more inclusive of more communities in visual opportunities going forward.
What an inclusive and sustainable city looks like was the crux of the issue that Resource Media posed as we deployed our image research project with the Bullitt Foundation and their grantees, Cascade Bicycle Club and Washington Environmental Council.
“We’ve been advocating for green stormwater infrastructure (GSI) for decades, from regulations to capital funding. Public awareness and support is critical for this work. However, to help build that awareness and support, we were using imagery based on a lot of assumptions – assuming the public could recognize a rain garden, assuming specific values were intrinsic in standalone images.
The research led by Resource Media was tremendously helpful in challenging those assumptions, determining more effective visuals, and giving us a chance to really listen to diverse communities so we can better serve their needs.“ –DANIELLE SHAW, Puget Sound Program Associate, Washington Environmental Council
The goal of the studies wasn’t just to ascertain which images people liked or disliked, but to read into the images for messaging cues, which were analyzed alongside other text-based questions on priorities and behaviors, and compared with different groups, distinguishable by race, gender, age, location and other answers to their questions.
Image tests can be deployed using a variety of different approaches, some use A/B testing and change just one factor in a graphic—e.g. a red hat or blue hat, and see which one wins out. In the end you might find out that 65 percent of people prefer the red hat, but you won’t necessarily know why.
In the simplest of terms, this was image-based message testing. We’re testing imagery, yes, but we’re also finding valuable insights into the messaging that should be used when discussing these issues.
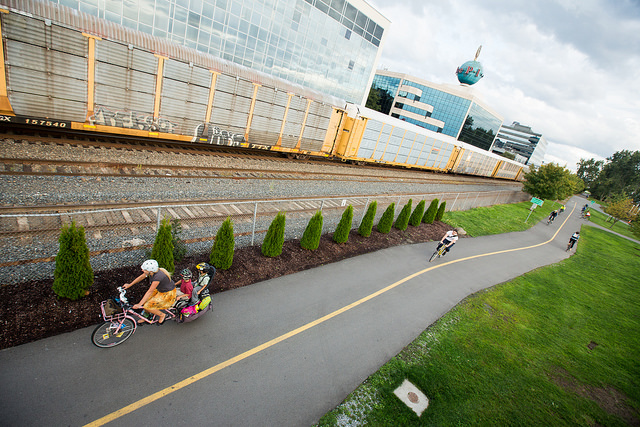
Photo by Adam Coppola
For example, in this set of photos wanted to understand, “which photo most represents a livable community to you?” The first photo showed bike infrastructure in Seattle, a protected bike path, green space, we included a family.
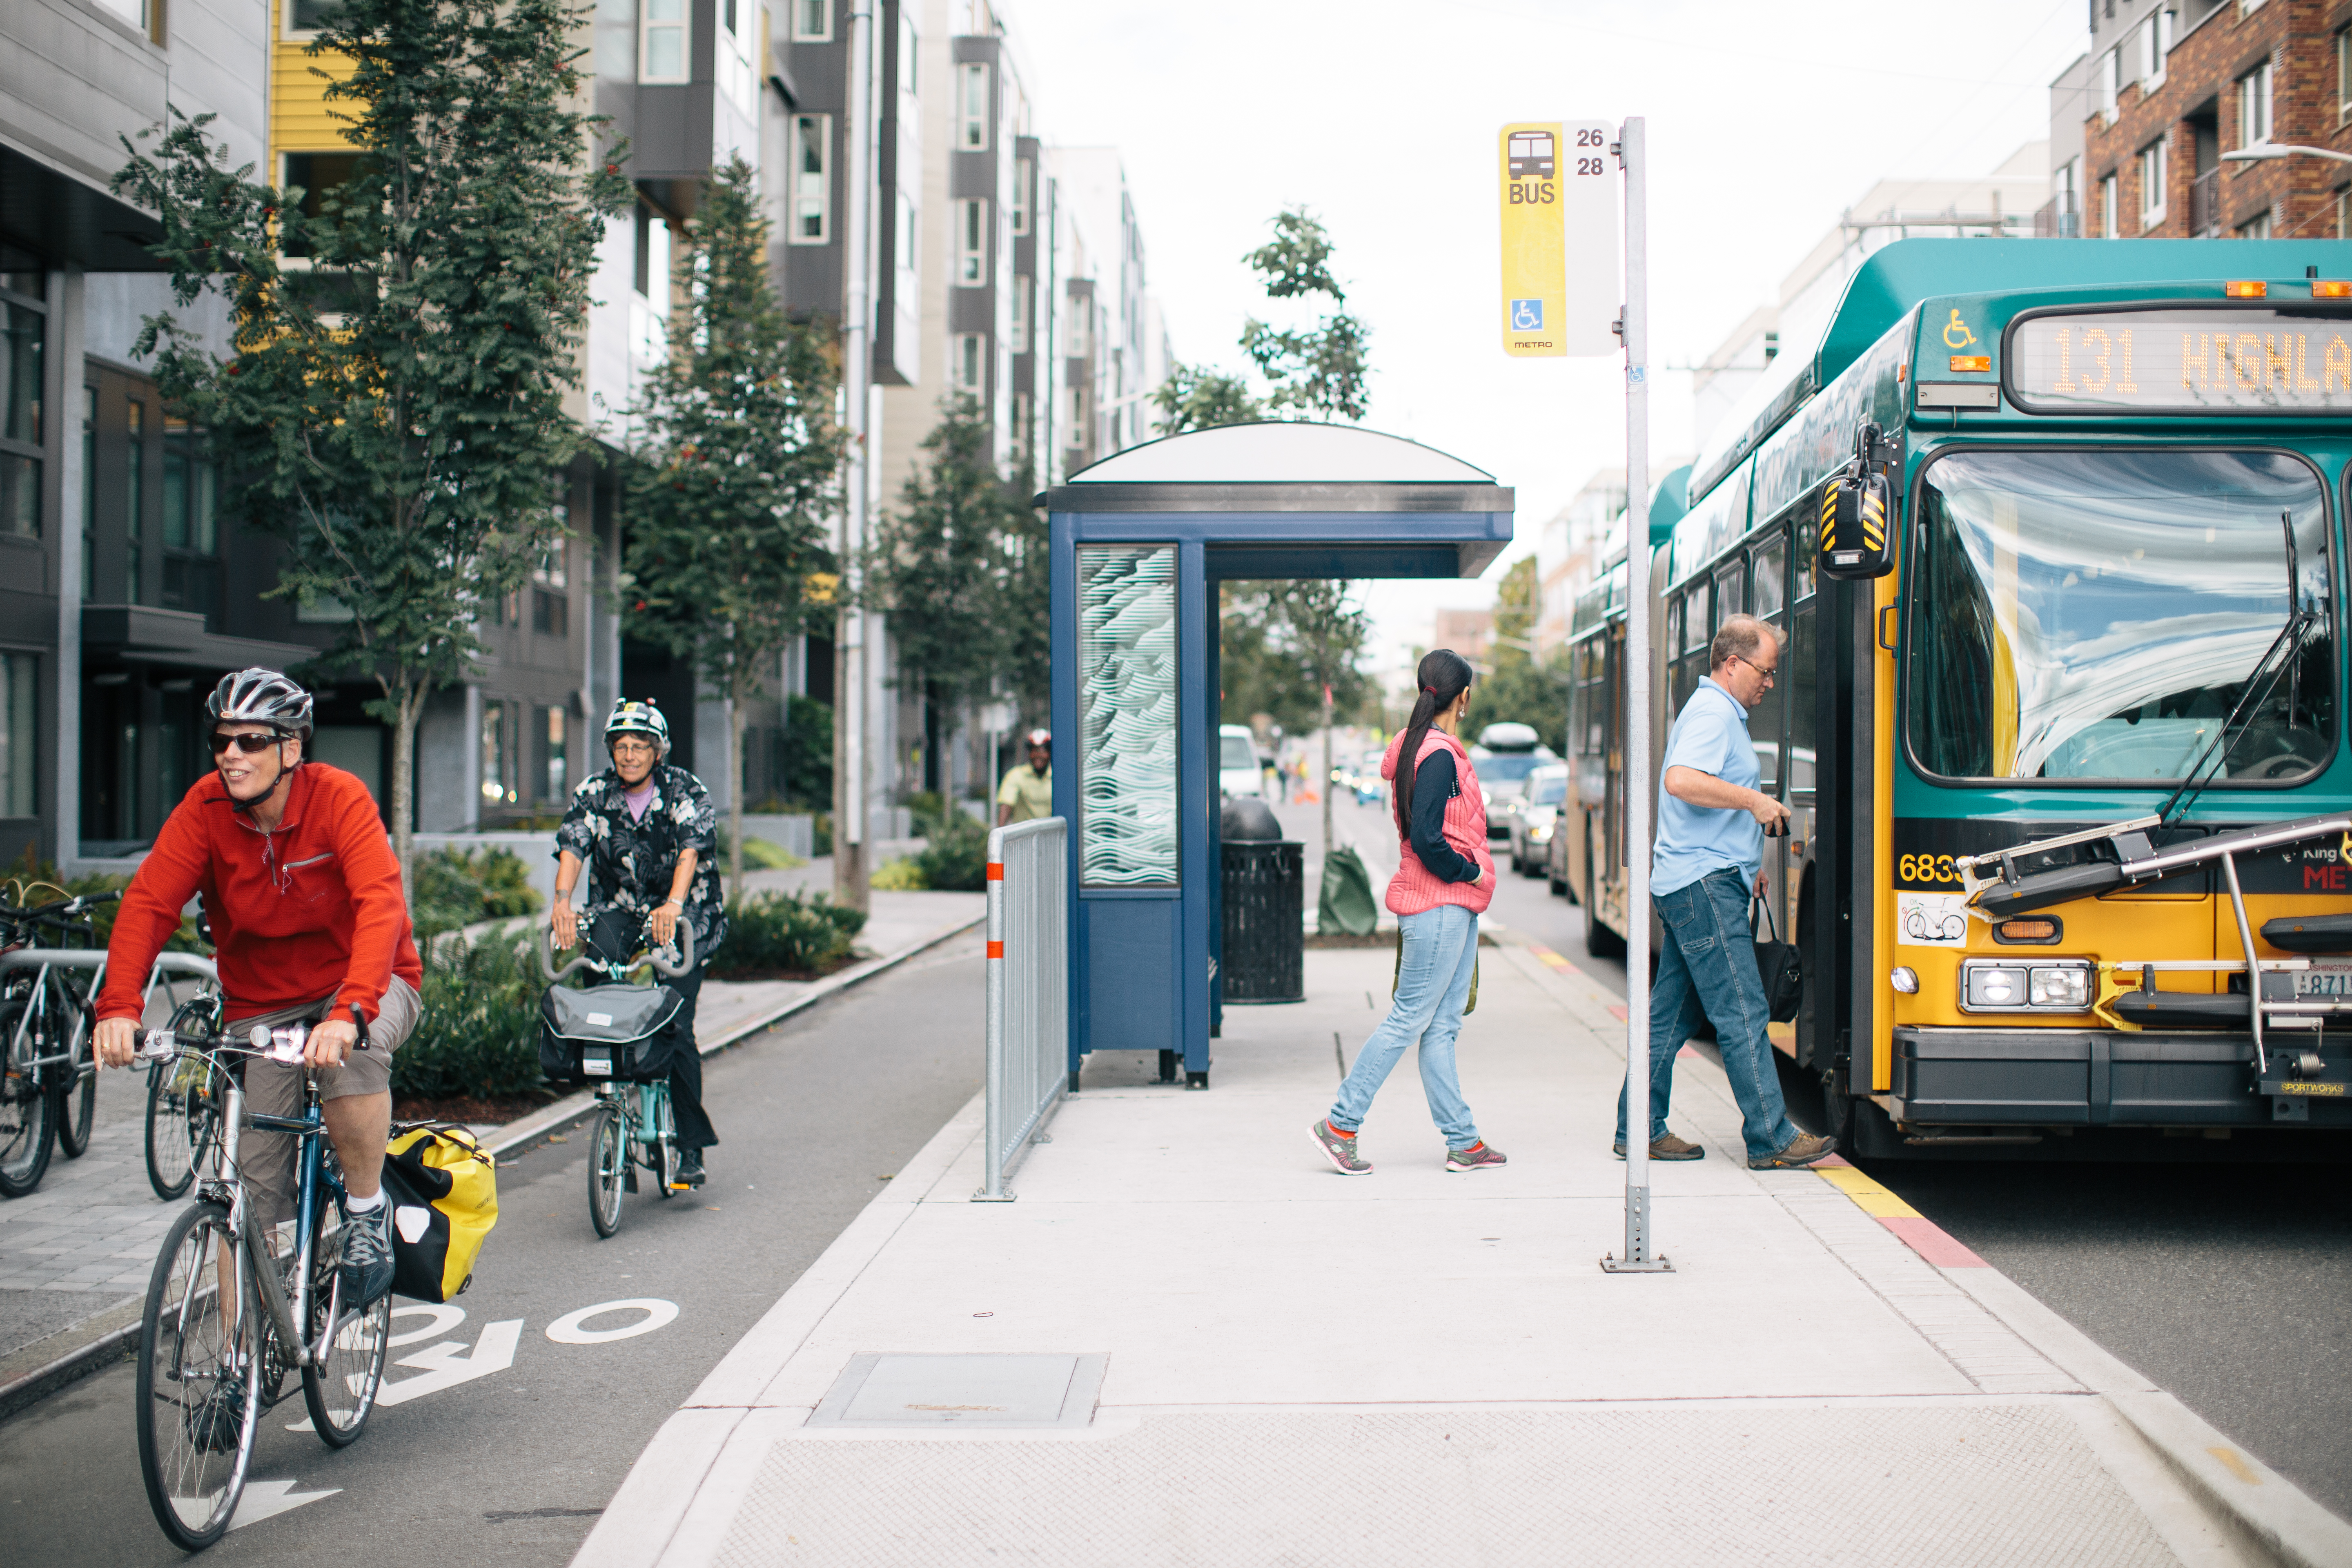
Photo by Adam Coppola
The second photo was more popular—it’s at the ground level, you can see people who are biking and non-biking, we’re seeing public transit and protected bike paths alongside. The subjects’ faces are visible, and the audience can imagine itself a bit better in this photo.
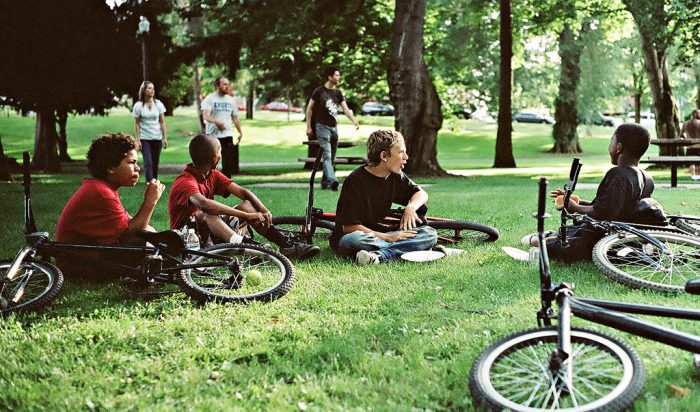
Photo by Ethan Hickerson (Flickr creative commons)
The last photo performed the best with non-members, by 12 percentage points. The pace of this photo is a bit different—rather than showing people actively biking, the kids have finished biking, they’ve reached their destination, a park, and they’re just relaxing with friends. Think about the underlying core values that imagery is portraying. It’s freedom, the kids are just hanging out, no adults around, it’s again social time with friends, and the community values that surround this photo—a dedication to parks, public spaces and green space, as well as racial diversity and harmony.
Here’s another example. One commonly held but untested theory when depicting rain gardens is that the better photos are of mature plantings and beautiful flowers. For this test we asked, “which project would you most likely support in your community and why?” We wanted to test whether this theory held up, when tested alongside another benefit of rain gardens: sidewalks, which provide the ancillary community walkability and safety. A lack of sidewalks is also more common among lower-income neighborhoods with a history of under-investment.
The findings showed that 72 percent of people preferred photos of rain gardens; even ones with less mature plantings, if they had a si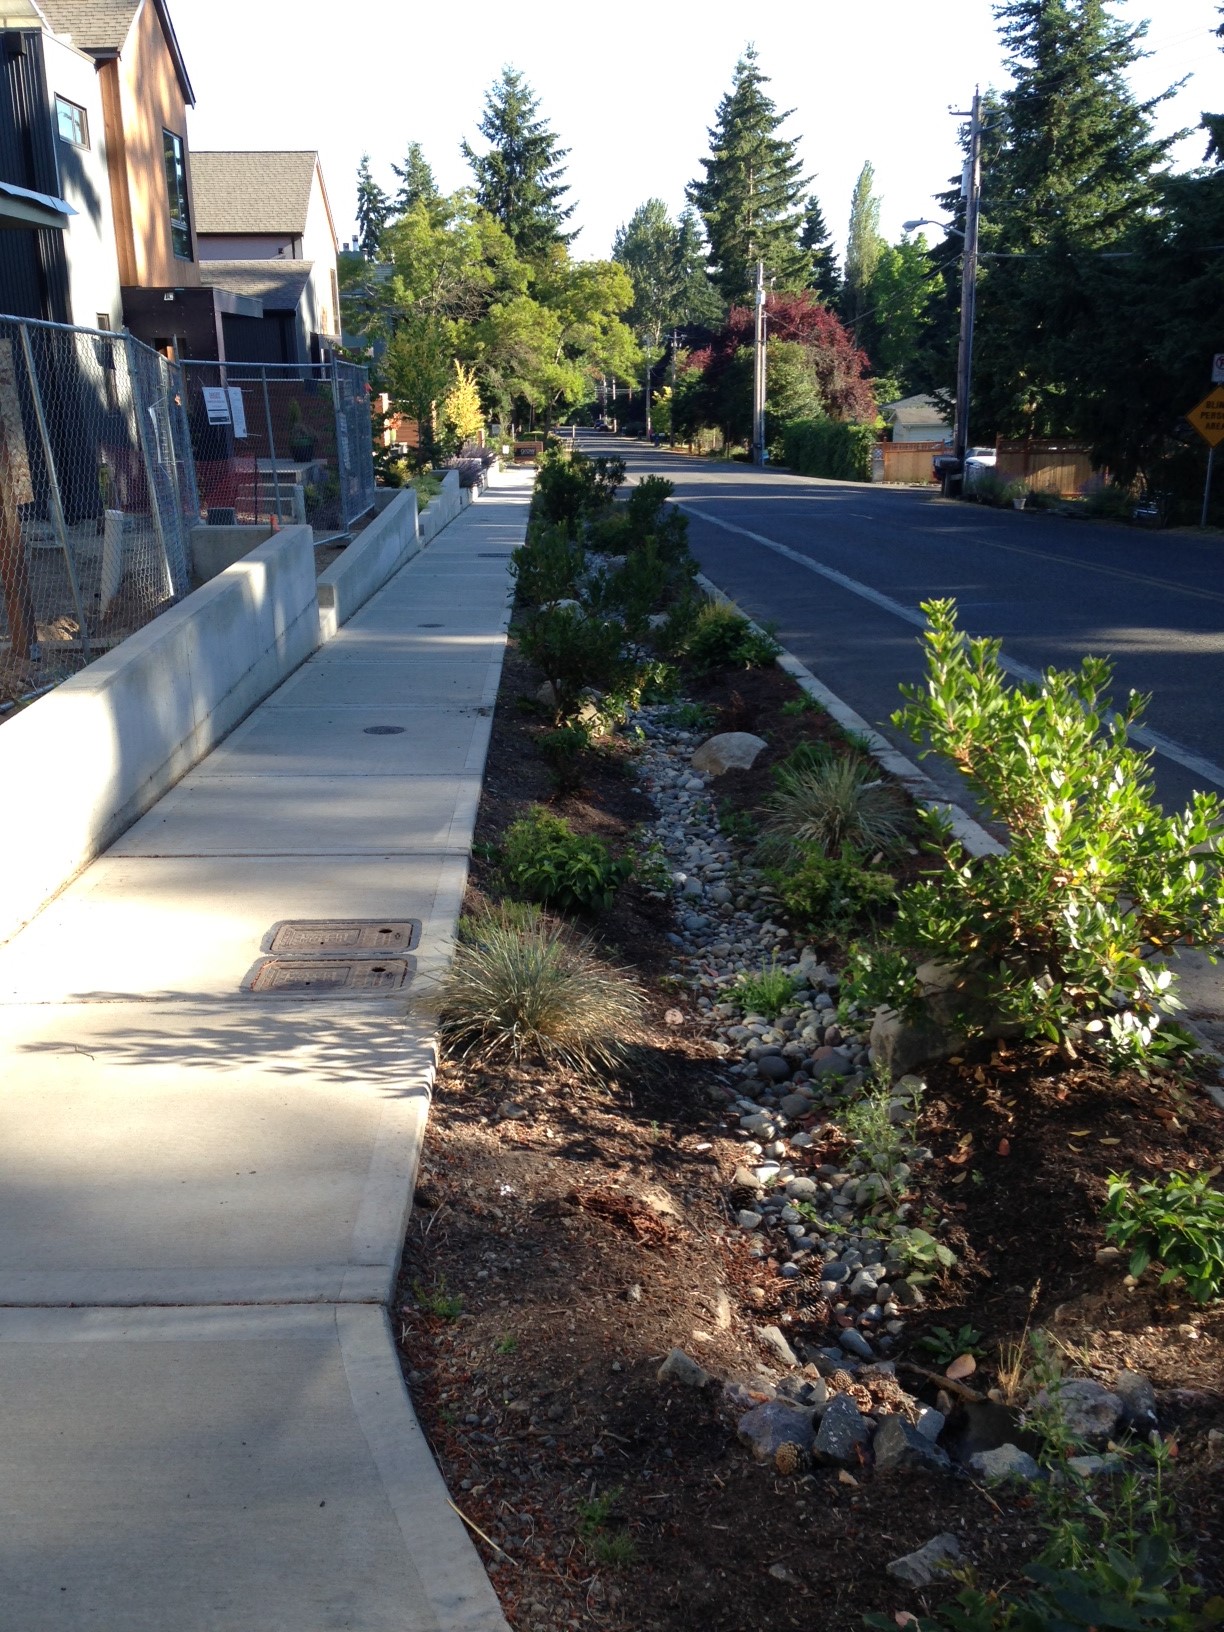 dewalk next to it. What’s more, they identified the sidewalk as the feature that made the image more appealing.
This may seem like a subtle shift, but the overarching strategy is to understand that not all communities care about gardening, drainage and polluted runoff and that’s okay. If we depict green infrastructure in the background of and together with other community priorities, we will widen our tent of support and galvanize more people in support of these projects.
Those are just a couple of examples that came up in our research project, for more please read our full report, and watch our recorded webinar.
Recommendations:
- Use photography that represents the diversity of our cities and urban areas
- Portray community values beyond environmental messages, such as social connection, family and freedom
- People are concerned with affordability and fast development, emphasize value of new amenities, such as sidewalks or bus stops, and public services
- People of color are just as likely, or more likely, to favor green projects but major barriers still exist to specific behaviors and engagement, so give time and resources to local leaders of color
- Go to VisualStoryLab.org for more tips and tricks for strategic visual storytelling!
— Sian Wu
DOWNLOAD the full report here.